Key takeaways
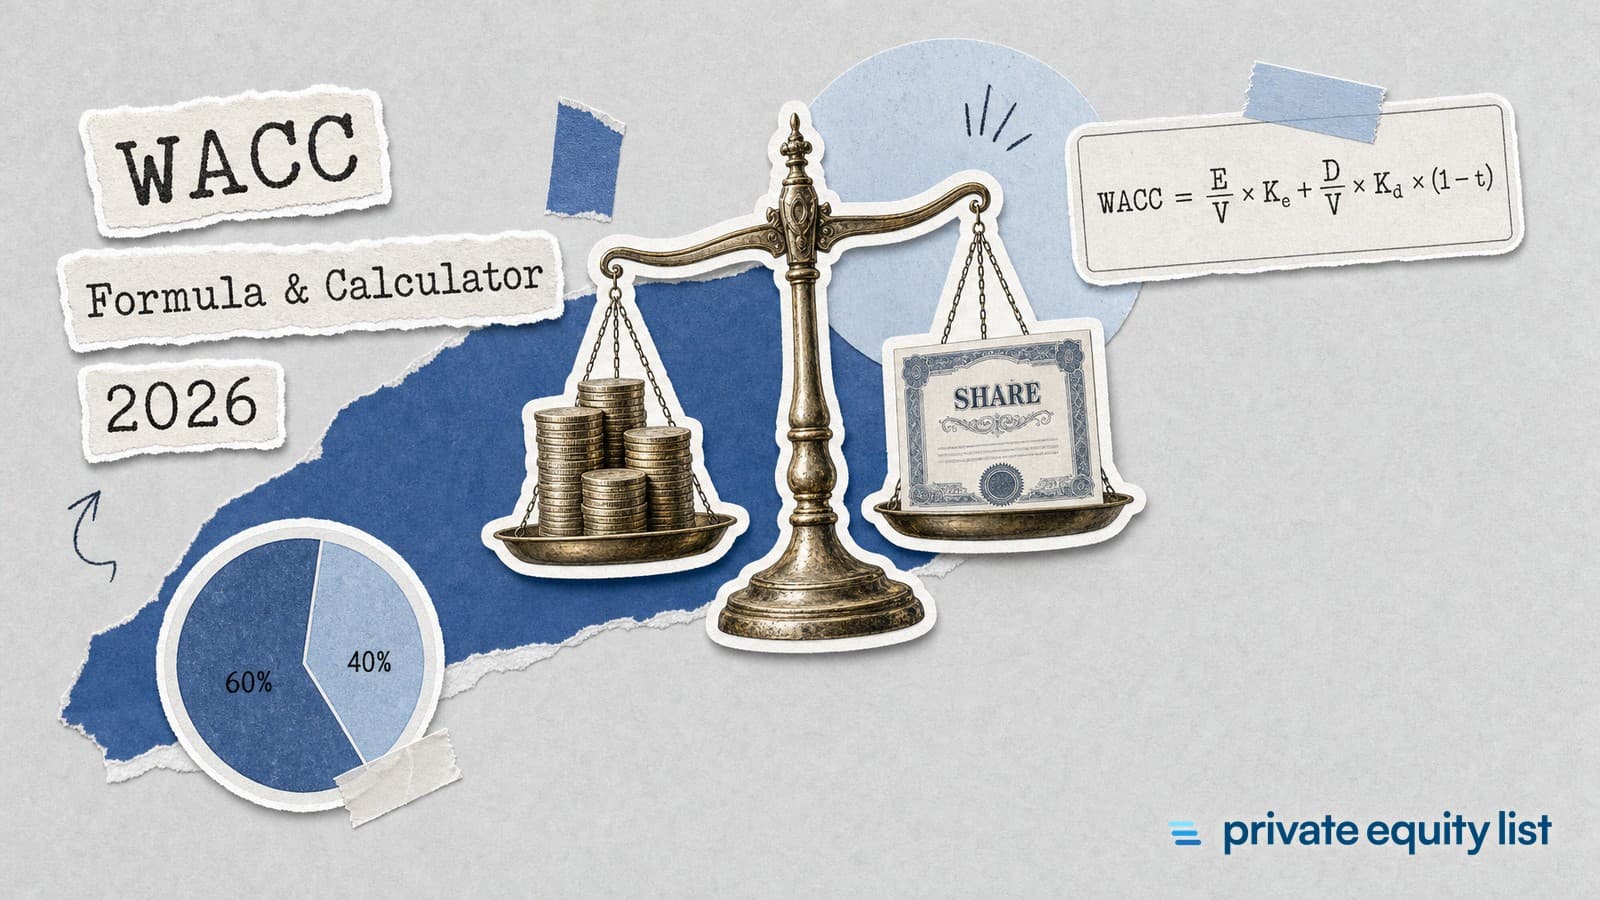
- The formula: WACC = E/V × Ke + D/V × Kd × (1 − t). A company funded 60% by equity at 10.5% and 40% by debt at 7%, with a 25% tax rate, has a WACC of 8.40%.
- Market inputs now: the 10-year US Treasury yielded 5.10% on 12 November 2026. Kroll recommends a 5.0% US equity risk premium; Damodaran's implied premium was 4.41% on 1 November 2026.
- Benchmarks: the average US listed company had a WACC of 6.96% in January 2026, by Damodaran's data. Utilities sat at 4.36%, semiconductor makers at 10.55%.
- Private companies pay more: a leveraged buyout funded 60% by unitranche debt at about 8.9% and 40% by equity at 15.5% lands near 10.2%.
- Cost of debt: unitranche loans price at SOFR + 450–550 bps, about 8.4–9.4% today. Venture debt runs 10–14% and mezzanine 12–20%.
- Who lends: Private Equity List tracks 242 private credit firms, including 60 private equity lenders, 59 mezzanine lenders and 38 venture debt lenders, as of November 2026.
WACC calculator
Formula: WACC = E / (E + D) × Ke + D / (E + D) × Kd × (1 − t), where E and D are the market values of equity and debt.
Weights: $60M of equity and $40M of debt give 60.0% equity and 40.0% debt.
Cost of equity (CAPM): Ke = 4.5% + 1.2 × (9.5% − 4.5%) = 10.5%.
Cost of debt after tax: 7.0% × (1 − 25%) = 5.25%.
WACC: 60.0% × 10.5% + 40.0% × 5.25% = 8.40%.
Sources for the inputs: Treasury yields are from the US Treasury daily yield curve (10-year 5.10%, 20-year 5.48%). SOFR, 3.90% on 12 November 2026, is from the New York Fed. Kroll's premium is on its recommended US equity risk premium page. The implied premium is from Damodaran's home page, and the industry figures from his cost of capital by sector table.
What is WACC: the weighted average cost of capital
WACC meaning: the average yearly return a company has to pay everyone who funds it, shareholders and lenders, weighted by how much each puts in.
Why it matters: it is the bar a project or an acquisition has to clear. A return below the WACC destroys value, even if it is positive.
Where it is used: as the discount rate for free cash flow in a DCF valuation, in capital budgeting, and to test whether a deal pays for its funding.
Why debt lowers it: lenders are repaid first, so they accept less than shareholders. Interest is also tax-deductible, which cuts the real cost of debt further.
WACC formula: how to calculate WACC
WACC = E/V × Ke + D/V × Kd × (1 − t)
E is the market value of equity, D the market value of debt and V = E + D. Ke is the cost of equity, Kd the pre-tax cost of debt and t the tax rate. The formula takes each source of money, prices it and weights it by its share of the total.
| Input | What it is | Where to get it | Now |
|---|---|---|---|
| Equity value (E) | What the shares are worth | Market capitalisation; for a private company, the last round or deal price | Company-specific |
| Debt value (D) | What the loans and bonds are worth | Market value of bonds; book value of loans is the usual shortcut | Company-specific |
| Cost of equity (Ke) | The return shareholders require | CAPM: risk-free rate + beta × equity risk premium | About 10% at beta 1.0 (5.10% + 5.0%) |
| Cost of debt (Kd) | The interest rate the company would pay on new debt | Bond yield to maturity, or the rate lenders quote today | 5.29% average for listed US companies; 8.4–9.4% for a unitranche loan |
| Tax rate (t) | The rate at which interest is deducted | The marginal corporate tax rate | 21% US federal, 25% UK |
Tax rates: 21% is the US federal rate under 26 U.S.C. § 11, before state taxes. The UK main rate is 25%, per gov.uk.
Market values: weights use what the equity and debt are worth today. Book equity on the balance sheet is usually far below market value and overweights debt.
Preferred shares: if a company has them, add a third term, P/V × Kp, and include P in V.
WACC calculation, step by step
| Step | Calculation | Result |
|---|---|---|
| 1. Total value | $60M equity + $40M debt | V = $100M |
| 2. Weights | 60 / 100 and 40 / 100 | E/V = 60%, D/V = 40% |
| 3. Cost of equity | 4.5% + 1.2 × 5% | Ke = 10.5% |
| 4. After-tax cost of debt | 7% × (1 − 25%) | 5.25% |
| 5. WACC | 60% × 10.5% + 40% × 5.25% = 6.30% + 2.10% | 8.40% |
What it means: this company needs to earn 8.40% a year on its capital to pay its shareholders and lenders what they expect.
Check it: these are the calculator's default inputs. Change one and the steps update under the result.
The cost of equity step: beta, the risk-free rate and the premium are explained in our cost of equity calculator, which also re-levers beta for a private company.
WACC calculation examples: listed company, buyout, startup
| Case | Inputs | WACC |
|---|---|---|
| Listed company (the calculator default) | 60% equity at 10.5%, 40% debt at 7%, tax 25% | 6.30% + 2.10% = 8.40% |
| Private company in a leveraged buyout | 40% equity at 15.5% (re-levered beta 1.80 plus a 2% size premium), 60% unitranche at 8.9%, tax 25% | 6.20% + 4.01% ≈ 10.2% |
| Loss-making startup | 90% equity at 20%, 10% venture debt at 12%, tax 0% (no profit to deduct interest from) | 18.0% + 1.2% = 19.2% |
Illustrative examples, not data.
The buyout: the same industrial business as a listed company would sit near the 7.70% Damodaran gives for machinery makers. Inside a buyout it costs about 10.2%, because equity carries more risk and the debt comes from private credit funds rather than the bond market.
The startup: with no taxable profit, interest saves no tax, so set the tax rate to 0. Most of the money is equity, and venture equity is expensive, so WACC lands near the cost of equity.
Rule of thumb: the riskier and smaller the company, the further its WACC sits above the listed-company averages below.
WACC by industry 2026: from 4.4% for utilities to 10.6% for chip makers
The spread: 5,994 listed US companies average 6.96%; leave out banks and insurers and the figure is 7.72%.
Why they differ: chip and software makers carry high betas and little debt, so equity dominates and WACC is high. Utilities borrow heavily against steady cash flows and have low betas.
How to use the table: as a sanity check. A software company valued with a 5% WACC, or a utility with 11%, needs a reason.
Listed companies only: the data are for listed US companies at January 2026 rates. Private companies, and the 10-year yield since then, push the figures up.
Cost of debt: who lends and what it costs
For a listed company, Kd is the yield on its bonds. A private company has no bonds, so Kd is the rate its lenders charge. That depends on where the loan sits in the capital stack.
| Type of debt | Typical price | All-in rate now | Source |
|---|---|---|---|
| Listed company bonds and loans | Average pre-tax cost of debt | 5.29% (January 2026) | Damodaran |
| Unitranche (senior private credit) | SOFR + 450–550 bps | About 8.4–9.4% | Houlihan Lokey |
| Venture debt | Fixed or floating, plus warrants | 10–14% | Mercury, Ramp (10–13.5%) |
| Mezzanine | Cash interest plus PIK and equity kickers | 12–20% | CFI, CAIS |
Unitranche today: with SOFR at 3.90% on 12 November 2026, a spread of 450–550 bps gives 8.4–9.4%. Our buyout example uses the middle, 8.9%.
Blended debt: if the deal uses two layers, weight each one by its size, the same way WACC weights debt and equity.
 United States | |
|---|---|
 United Kingdom | |
 Canada | |
 India | |
 France | |
 Hong Kong | |
 Australia |
Source: Private Equity List database
| $100M+ | 54 | 22.3% |
|---|---|---|
| $50–100M | 54 | 22.3% |
| $10–50M | 104 | 43.0% |
| Under $10M | 30 | 12.4% |
Source: Private Equity List database
242 private credit firms: that is how many debt funds Private Equity List tracks, as of November 2026. 138 are based in the US and 32 in the UK.
Cheque sizes: 104 of them typically lend $10–50M, and 108 write $50M or more. Under $10M, the choice narrows to 30 firms.
Lenders by layer of debt
| Firm | HQ | Cheque size | Layer | What it provides |
|---|---|---|---|---|
 Golub Capital | New York | $100M+ | Unitranche | Known for pioneering unitranche; loans and multi-currency facilities to sponsor-backed companies |
 Antares Capital | Chicago | $100M+ | Unitranche | Senior secured loans, mezzanine and structured equity; lead lender in over 90% of its deals |
 Churchill Asset Management | New York | $100M+ | Unitranche | First lien, unitranche, second lien and mezzanine for US middle-market private equity firms |
 Monroe Capital | Chicago | $50–100M | Unitranche | Direct lending to companies of private equity firms and independent sponsors |
 HPS Investment Partners | New York | $10–50M | Mezzanine | Mezzanine, leveraged loans and other credit across the capital structure |
 Northcreek Mezzanine | Cincinnati | $50–100M | Mezzanine | Mezzanine for lower middle-market companies, as an SBIC |
 Charter Capital Partners | Grand Rapids | $100M+ | Mezzanine | Junior capital for lower middle-market companies in the Great Lakes region |
 Nordic Mezzanine | London | $50–100M | Mezzanine | Mezzanine for buyouts, growth and restructurings, backed by Nordic institutions |
 Hercules Capital | Palo Alto | $50–100M | Venture debt | Venture debt and equity for life sciences and technology companies |
 TriplePoint Capital | Menlo Park | $10–50M | Venture debt | Venture debt for venture-backed companies at different stages |
 Runway Growth Capital | Menlo Park | $10–150M | Venture debt | Loans to late and growth-stage companies |
 Claret Capital Partners | London | $50–100M | Venture debt | Growth debt for European technology, life sciences and impact companies |
Full lists: all 60 are in our guide to private equity lenders, the 59 junior lenders in mezzanine lenders and funds, and the 38 startup lenders in venture debt lenders.
Every debt fund: filter all 242 by country and cheque size in the debt fund directory. The wider market is covered in private credit funds and firms.
How debt changes WACC
| 0% debt | 9.0% |
|---|---|
| 10% | 8.89% |
| 20% | 8.78% |
| 30% | 8.77% |
| 40% | 8.93% |
| 50% | 9.28% |
| 60% | 9.9% |
| 70% | 10.84% |
Source: Illustrative calculation, not market data
Illustrative example, not data: unlevered beta 0.9, risk-free rate 4.5%, premium 5%, tax 25%. The pre-tax cost of debt rises from 6% at low leverage to 11% at 70% debt.
The first turns of debt help: debt is cheaper than equity and saves tax, so WACC falls from 9.0% to about 8.8% at 20–30% debt.
Then it turns: more debt raises the re-levered beta, so the cost of equity climbs. Lenders also charge more. Past about 40% debt, WACC rises again.
The debt-to-equity ratio: this is why D/E affects WACC in both directions. The cheapest mix depends on how steady the cash flows are; utilities stretch further than software companies.
In buyouts: private equity firms push debt to 50–60%. Their target is the equity return, and extra debt lifts it even after WACC starts to rise.
WACC vs discount rate vs cost of equity
| WACC | Cost of equity | Hurdle rate | |
|---|---|---|---|
| Whose return | Everyone who funds the company | Shareholders only | Whoever sets it: the board, or a fund's investors |
| Formula | E/V × Ke + D/V × Kd × (1 − t) | Rf + β × (Rm − Rf) | Set by policy, often WACC plus a margin |
| Discounts | Free cash flow to the firm | Cash flow to equity | Used as a pass or fail test, not to discount |
| Typical level | 6.96% average US listed company | Higher than WACC whenever there is debt | 8% preferred return is common in private equity funds |
Is WACC the same as discount rate: WACC is the discount rate for free cash flow to the whole firm in a DCF. For cash flow to shareholders only, discount at the cost of equity instead.
Project risk: a riskier project than the company's usual work deserves a higher rate than the company-wide WACC.
Fund hurdle: the 8% preferred return private equity funds promise investors is explained in our post on the hurdle rate in private equity.
What is a good WACC
Lower is better for the company: a low WACC means cheap capital, so more projects clear the bar and valuations come out higher.
What a WACC of 12% means: the company must earn at least 12% a year on its capital. Anything less leaves shareholders short of the return they expect.
Is 15% WACC high: for a listed US company, yes. It is roughly double the 6.96% average and above every industry in Damodaran's table. For a small private company or a startup, 15–20% is normal.
Typical ranges: listed US companies 4–11% by industry; leveraged buyouts around 10%; venture-backed startups 15–25%, mostly cost of equity.
WACC formula in Excel
Lay it out in cells: equity in B1, debt in B2, cost of equity in B3, pre-tax cost of debt in B4, tax rate in B5.
The formula: =B1/(B1+B2)*B3+B2/(B1+B2)*B4*(1-B5). With the calculator's defaults ($60M, $40M, 10.5%, 7%, 25%) it returns 8.40%.
Cost of equity in a cell: =Rf+Beta*ERP, for example =4.5%+1.2*5% gives 10.5%.
Check against the calculator: enter the same numbers above and the results should match to the second decimal.
How private equity uses WACC
Valuing targets: buyers discount the target's free cash flow at its WACC, then check the price against multiples from comparable deals. Both feed the valuation and investment committee stages of the PE and VC investment process.
Pricing the debt: the cost of debt in a buyout is the rate quoted by private credit funds. That is why lender choice moves WACC by a point or more.
The equity return: model it with the IRR calculator and compare it with the cost of equity, not with WACC.
Ownership after a round: for founders raising equity rather than debt, the dilution calculator shows what each round costs in ownership.
Who runs these models: Private Equity List tracks 3,550 private equity firms and 242 debt funds. New funds raised in 2026 are on the new VC funds tracker, and our capital raise guide covers how to run a raise. Contacts and exports are on the pricing page.
Data and methodology
Formulas: the WACC, CAPM and after-tax cost of debt formulas are standard corporate finance. The WACC calculator runs them in your browser and keeps nothing.
Market inputs: Treasury yields, SOFR, the equity risk premium, tax rates, industry WACCs and debt pricing come from the sources linked in the text, as of 12 November 2026. Check them again before you use the result.
Lenders: firm counts, headquarters and cheque sizes come from Private Equity List profiles of debt funds, as of November 2026; lenders were checked by profile description, as in our lender guides.
Worked examples: illustrative companies with round numbers, not Private Equity List data.

 Updated weekly
 Investors