Key takeaways
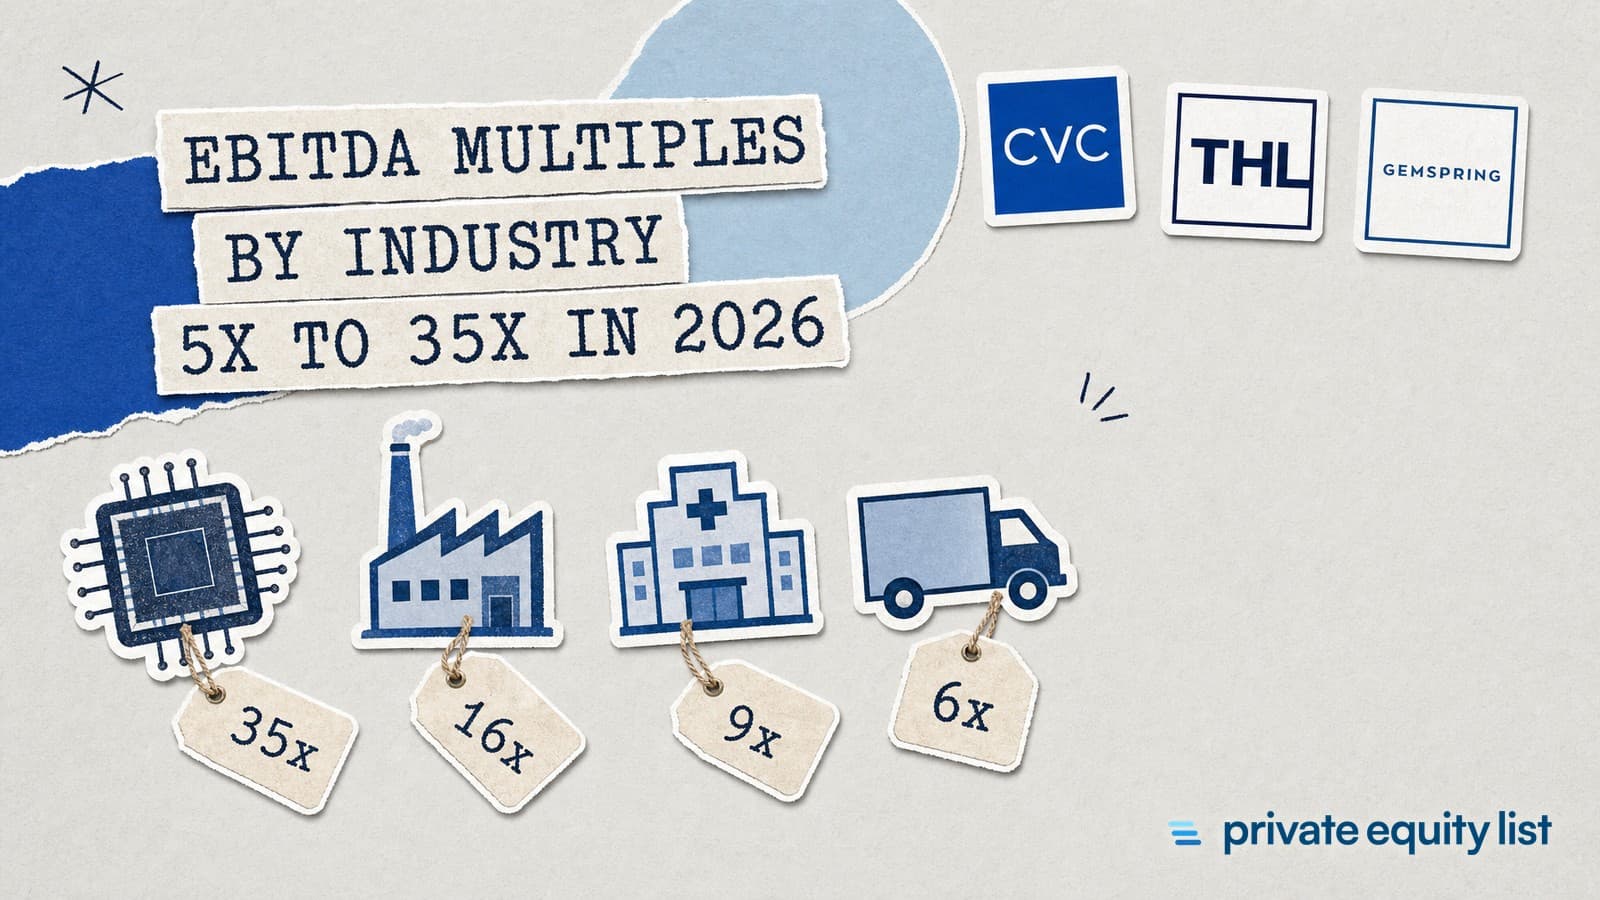
- The short answer: EBITDA multiples by industry run from about 5x to 35x for most listed US industries, with 16.95x the average outside finance in January 2026. Private companies sell for much less: US middle market private equity deals averaged 7.0x EBITDA in Q2 2026, and eurozone mid-market deals 8.8x.
- Highest: auto and truck makers stand apart at 47.76x; after them come semiconductors (34.75x), internet software (30.26x), electrical equipment (24.59x) and application software (24.48x), per Damodaran's January 2026 data.
- Lowest: oil and gas production (5.15x), auto parts (6.43x), telecom services (6.54x) and air transport (7.58x).
- Funds pay more than corporates in Europe: investment funds paid a median 10.2x EBITDA in Q2 2026 against 7.9x for strategic buyers, by the Argos Index. 27% of deals went for less than 7x.
- Who is buying: Private Equity List tracked 64 buyout and growth funds announced in 2026 by 62 firms, about $137B in total, as of November 2026. 36 of them name business services, 27 software and technology, 25 healthcare.
- Typical fund: the median 2026 buyout or growth fund is about $960M; 31 of the 64 are $1B or larger.
 United States | |
|---|---|
 United Kingdom | |
 Norway | |
 Luxembourg | |
 Hong Kong | |
 Vietnam |
Source: Private Equity List database
| $1B+ | 31 | 48.4% |
|---|---|---|
| $500M–1B | 12 | 18.8% |
| $250–500M | 13 | 20.3% |
| Under $250M | 8 | 12.5% |
Source: Private Equity List database
Sources: listed company multiples come from Aswath Damodaran's EV/EBITDA by industry and revenue multiples by industry tables (US companies, January 2026). US private equity multiples are GF Data figures from Mercer Capital's Middle Market Transaction Update, Fall 2026. Eurozone figures are from the Argos Index for Q2 2026.
One fund each:  Canada,
 Netherlands,
 Italy,
 France,
 Poland,
 Bulgaria,
 Thailand and
 India.
What is an EBITDA multiple
Formula: EBITDA multiple = enterprise value ÷ EBITDA. A company bought for $40M with $5M of EBITDA was priced at 8x.
Enterprise value: the price of the whole business, equity plus net debt. It is the same whoever funds the company, so multiples compare cleanly across firms with different debt.
EBITDA: earnings before interest, tax, depreciation and amortisation. Buyers use adjusted EBITDA, which adds back one-off costs and owner pay above market.
What a 10x multiple means: the buyer pays $10 for each $1 of yearly EBITDA. Before debt, tax and capital spending, that is a 10% yield on the price.
| Step | Calculation | Result |
|---|---|---|
| 1. Adjusted EBITDA | Operating profit + depreciation and amortisation + one-off costs | $5M |
| 2. Industry multiple | Recent deals in the sector and size band | 8x |
| 3. Enterprise value | $5M × 8 | $40M |
| 4. Net debt | $12M of loans − $2M of cash | $10M |
| 5. Equity value | $40M − $10M | $30M |
Illustrative example, not data. Run your own numbers in the business valuation calculator, which has EBITDA multiple, revenue multiple and DCF tabs.
EBITDA multiples by industry in 2026: the full table
How to read it: EV/EBITDA uses companies with positive EBITDA. EV/revenue covers all companies in the industry, so it also works for loss-making sectors like biotech.
Middle of the range: among 75 industries outside finance with 10 or more companies, the middle one trades at 13.36x EBITDA.
Margins drive revenue multiples: application software earns a 33.21% operating margin and trades at 11.41x revenue. Food wholesalers earn 2.55% and trade at 0.46x.
Banks are blank: EBITDA means little for lenders, so Damodaran shows no EV/EBITDA for money centre and regional banks.
| Industry | EV/EBITDA | EV/revenue | Operating margin | Companies |
|---|---|---|---|---|
| Advertising | 12.00x | 2.12x | 10.05% | 52 |
| Aerospace/Defense | 21.58x | 3.57x | 8.70% | 79 |
| Air Transport | 7.58x | 1.03x | 4.88% | 23 |
| Apparel | 10.30x | 1.59x | 9.89% | 35 |
| Auto & Truck | 47.76x | 3.88x | 2.38% | 33 |
| Auto Parts | 6.43x | 0.82x | 5.80% | 35 |
| Bank (Money Center) | — | 8.31x | 0.08% | 15 |
| Banks (Regional) | — | 4.28x | -0.12% | 568 |
| Beverage (Alcoholic) | 8.61x | 2.45x | 22.79% | 14 |
| Beverage (Soft) | 16.90x | 4.16x | 20.63% | 27 |
| Broadcasting | 7.85x | 1.40x | 12.35% | 24 |
| Brokerage & Investment Banking | — | 5.78x | -0.12% | 32 |
| Building Materials | 11.61x | 2.05x | 12.80% | 41 |
| Business & Consumer Services | 14.26x | 2.53x | 12.32% | 155 |
| Cable TV | 6.21x | 2.06x | 18.24% | 9 |
| Chemical (Basic) | 8.57x | 0.85x | 2.86% | 29 |
| Chemical (Diversified) | 8.39x | 0.84x | 3.41% | 4 |
| Chemical (Specialty) | 13.36x | 2.65x | 12.41% | 59 |
| Coal & Related Energy | 10.37x | 2.54x | -3.82% | 16 |
| Computer Services | 14.10x | 1.48x | 7.63% | 64 |
| Computers/Peripherals | 25.42x | 6.63x | 22.49% | 36 |
| Construction Supplies | 16.82x | 3.23x | 15.27% | 40 |
| Diversified | 11.42x | 3.08x | 22.82% | 20 |
| Drugs (Biotechnology) | 15.78x | 7.92x | 8.76% | 496 |
| Drugs (Pharmaceutical) | 15.25x | 6.24x | 29.54% | 228 |
| Education | 9.26x | 1.99x | 13.54% | 32 |
| Electrical Equipment | 24.59x | 4.42x | 9.75% | 112 |
| Electronics (Consumer & Office) | 30.70x | 0.91x | -4.25% | 8 |
| Electronics (General) | 19.99x | 3.21x | 10.52% | 114 |
| Engineering/Construction | 17.18x | 1.74x | 6.75% | 48 |
| Entertainment | 19.41x | 4.33x | 10.38% | 92 |
| Environmental & Waste Services | 15.61x | 3.70x | 14.85% | 53 |
| Farming/Agriculture | 16.04x | 1.34x | 5.61% | 35 |
| Financial Svcs. (Non-bank & Insurance) | 57.52x | 18.91x | 18.54% | 176 |
| Food Processing | 10.01x | 1.47x | 10.77% | 78 |
| Food Wholesalers | 11.08x | 0.46x | 2.55% | 13 |
| Furn/Home Furnishings | 11.27x | 1.33x | 6.88% | 27 |
| Green & Renewable Energy | 13.44x | 7.87x | 18.39% | 15 |
| Healthcare Products | 19.78x | 4.76x | 15.47% | 204 |
| Healthcare Support Services | 11.17x | 0.46x | 2.99% | 104 |
| Healthcare Information and Technology | 21.27x | 5.31x | 14.75% | 115 |
| Homebuilding | 8.92x | 1.19x | 12.63% | 30 |
| Hospitals/Healthcare Facilities | 8.86x | 1.69x | 12.86% | 31 |
| Hotel/Gaming | 14.93x | 4.33x | 16.44% | 63 |
| Household Products | 13.17x | 3.06x | 18.79% | 110 |
| Information Services | 11.50x | 2.21x | 12.45% | 15 |
| Insurance (General) | 15.76x | 4.32x | 21.46% | 21 |
| Insurance (Life) | 12.52x | 1.28x | 10.65% | 20 |
| Insurance (Prop/Cas.) | 8.44x | 1.49x | 15.30% | 57 |
| Investments & Asset Management | 38.03x | 5.49x | 25.18% | 283 |
| Machinery | 16.22x | 3.43x | 16.06% | 105 |
| Metals & Mining | 11.39x | 4.03x | 23.76% | 73 |
| Office Equipment & Services | 8.59x | 1.43x | 10.88% | 14 |
| Oil/Gas (Integrated) | 8.16x | 1.75x | 11.57% | 4 |
| Oil/Gas (Production and Exploration) | 5.15x | 2.68x | 25.82% | 142 |
| Oil/Gas Distribution | 11.56x | 4.37x | 26.06% | 23 |
| Oilfield Svcs/Equip. | 8.63x | 0.74x | 4.85% | 97 |
| Packaging & Container | 9.71x | 1.55x | 9.79% | 19 |
| Paper/Forest Products | 8.18x | 1.02x | 6.58% | 6 |
| Power | 12.38x | 4.70x | 21.36% | 46 |
| Precious Metals | 10.68x | 5.98x | 40.43% | 56 |
| Publishing & Newspapers | 11.24x | 1.70x | 9.84% | 19 |
| R.E.I.T. | 19.87x | 10.65x | 22.21% | 190 |
| Real Estate (Development) | 10.23x | 3.03x | 21.19% | 14 |
| Real Estate (General/Diversified) | 17.29x | 6.83x | 22.09% | 12 |
| Real Estate (Operations & Services) | 21.95x | 1.46x | 2.76% | 54 |
| Recreation | 10.39x | 1.94x | 8.06% | 49 |
| Reinsurance | 8.67x | 0.65x | 7.23% | 1 |
| Restaurant/Dining | 17.49x | 4.17x | 13.79% | 64 |
| Retail (Automotive) | 14.79x | 1.27x | 5.84% | 34 |
| Retail (Building Supply) | 14.42x | 2.26x | 11.82% | 14 |
| Retail (Distributors) | 13.71x | 1.89x | 10.32% | 62 |
| Retail (General) | 17.38x | 2.11x | 6.50% | 23 |
| Retail (Grocery and Food) | 8.94x | 0.49x | 1.85% | 15 |
| Retail (REITs) | 16.73x | 12.04x | 38.64% | 26 |
| Retail (Special Lines) | 11.47x | 1.63x | 8.08% | 94 |
| Rubber& Tires | 6.74x | 0.59x | 2.57% | 3 |
| Semiconductor | 34.75x | 15.70x | 35.31% | 66 |
| Semiconductor Equip | 24.74x | 7.61x | 26.29% | 31 |
| Shipbuilding & Marine | 7.95x | 1.74x | 13.52% | 8 |
| Shoe | 16.86x | 2.04x | 9.14% | 11 |
| Software (Entertainment) | 22.01x | 9.13x | 33.67% | 77 |
| Software (Internet) | 30.26x | 9.56x | 3.74% | 29 |
| Software (System & Application) | 24.48x | 11.41x | 33.21% | 309 |
| Steel | 11.59x | 1.17x | 4.11% | 19 |
| Telecom (Wireless) | 8.97x | 3.72x | 19.74% | 12 |
| Telecom. Equipment | 24.07x | 6.52x | 20.92% | 57 |
| Telecom. Services | 6.54x | 2.61x | 20.82% | 39 |
| Tobacco | 13.46x | 6.40x | 43.68% | 10 |
| Transportation | 12.55x | 1.64x | 7.64% | 19 |
| Transportation (Railroads) | 13.49x | 6.67x | 37.43% | 4 |
| Trucking | 10.41x | 1.74x | 7.31% | 26 |
| Utility (General) | 13.73x | 5.25x | 23.21% | 14 |
| Utility (Water) | 14.14x | 7.16x | 33.65% | 14 |
| All companies | 19.73x | 3.97x | 12.75% | 5,994 |
| All companies outside finance | 16.95x | 3.46x | 13.06% | 4,822 |
Source: Damodaran, EV/EBITDA by sector and price and value to sales ratios by sector, US companies, data as of January 2026. Operating margin is pre-tax.
Private company EBITDA multiples: what buyers pay in 2026
United States: the average all-industry multiple in US middle market private equity deals was 7.3x EBITDA in Q1 2026 and 7.0x in Q2, according to GF Data (Mercer Capital, 4 September 2026).
Eurozone: the Argos Index of unlisted companies worth €15–500M rose 2.3% to a median 8.8x EBITDA in Q2 2026, from 8.6x in Q1 (Argos Index Q2 2026).
Funds vs corporates: in the eurozone, investment funds paid 10.2x, up from a low of 8.3x in Q4 2025. Strategic buyers paid 7.9x, up from 7.8x.
Why funds paid more: 58% of fund-led deals in the first half of 2026 were in software, healthcare, IT and B2B services, against 35% for strategic buyers. Funds also paid more within the same sector, because they target the sector leader.
Spread of prices: 27% of eurozone deals went for less than 7x EBITDA in Q2 2026, up from 22%. Only 5% went above 15x, a historical low.
Listed vs private: the 16.95x listed average is more than double the 7.0x paid in US private equity deals. Listed shares trade every day and the companies are larger, so treat listed multiples as a ceiling for a private sale.
| Market | EBITDA multiple | Period | Who sets the price |
|---|---|---|---|
| Listed US companies, outside finance | 16.95x | January 2026 | Share price on the stock market |
| Eurozone mid-market (€15–500M), investment funds | 10.2x | Q2 2026 | Private equity buyers |
| Eurozone mid-market, all buyers | 8.8x | Q2 2026 | Funds and corporates |
| Eurozone mid-market, strategic buyers | 7.9x | Q2 2026 | Corporate acquirers |
| US middle market private equity | 7.0x | Q2 2026 | Private equity buyers |
For small owner-run businesses priced on seller's discretionary earnings, see the small business section of our business valuation calculator.
EBITDA multiples for software, SaaS and tech companies
Application software: 24.48x EBITDA and 11.41x revenue across 309 listed US companies, January 2026.
Internet software: 30.26x EBITDA, 9.56x revenue. Margins are thin at 3.74%, so few companies have the EBITDA to measure.
IT services: computer services trade at 14.10x EBITDA but only 1.48x revenue, on a 7.63% margin.
Healthcare IT: 21.27x EBITDA and 5.31x revenue across 115 companies.
SaaS valuation multiples: most SaaS companies are priced on revenue or ARR, because many have little EBITDA. The 11.41x revenue figure for application software is the listed benchmark; a private SaaS company with $10M of ARR sells for far less.
Pressure from AI: the Argos Index notes falling prices in high-multiple sectors such as software, "whose SaaS model is threatened by AI", in Q2 2026.
Who buys software in 2026: 27 of the 64 buyout and growth funds announced this year name software or technology. They include Serent Capital ($1.3B Fund VI), Bregal Milestone (€915M), Savano Capital Partners ($252M) and Longship in Oslo. More in private equity firms investing in software.
EBITDA multiples for manufacturing, healthcare and services
Manufacturing: listed machinery makers trade at 16.22x EBITDA, electrical equipment at 24.59x, specialty chemicals at 13.36x, building materials at 11.61x, packaging at 9.71x and auto parts at 6.43x.
Healthcare: healthcare products 19.78x, pharmaceuticals 15.25x, healthcare support services 11.17x and hospitals 8.86x. Products and IT carry higher margins than care delivery.
Business services: business and consumer services trade at 14.26x EBITDA and 2.53x revenue across 155 companies. Environmental and waste services trade at 15.61x.
Consumer: restaurants 17.49x, household products 13.17x, food processing 10.01x, grocery retail 8.94x.
Construction and transport: engineering and construction 17.18x, trucking 10.41x, transportation 12.55x.
Education: 9.26x EBITDA across 32 listed companies.
Private deals are lower: all of these are listed US multiples. US private equity paid 7.0x across all industries in Q2 2026, so expect a private company in these sectors to sell well below the listed figure.
Who buys at these multiples: 2026 buyout and growth funds by sector
 CVC Europe / Americas Fund X (target) | |
|---|---|
 Advent GPE XI | |
 West Street Capital Partners IX | |
 THL Equity Fund X | |
 PAG Asia buyout fund (planned) | |
 Gemspring Capital Fund IV | |
| CVC Catalyst III | |
 Kingswood Opportunities Fund IV |
Source: Private Equity List database, size as announced
Business services lead: 36 funds, about $75B, name business services. The sector trades at 14.26x listed. In the eurozone it is one of the four higher-multiple sectors where funds placed 58% of their deals.
Software and technology: 27 funds with a typical size of $1.3B, the largest of any sector.
Healthcare: 25 funds, about $68B. Specialists include Consonance Capital Partners ($1.35B), Sheridan Capital Partners ($1.1B) and Regal Healthcare Capital Partners ($610M).
Industrials: 20 funds, typical size $720M, with lower middle market buyers like Continuim Equity Partners and Iron Path Capital.
- CVC set a €26B ($28.6B) initial target for Europe / Americas Fund X. In July it also raised €3B for Catalyst III, its European mid-market fund.
- Advent International raised $30B across two funds: $27B for GPE XI and $3B for a mid-market fund, aimed at business services, consumer, financial services and healthcare.
- Goldman Sachs ESSG brought in $9.6B for West Street Capital Partners IX, part of $11.7B across three private equity funds.
- THL Partners raised $6.35B for Fund X, with financial services and food and beverage among its tagged sectors.
- PAG reportedly plans an Asia buyout fund of around $4B after returning more than $7B to investors.
- Gemspring Capital closed Fund IV at its $3.5B hard cap in less than three months.
- Kingswood Capital Management raised $4B across two funds, $3.1B of it in Opportunities Fund IV.
 Warren Equity closed Fund V at $2.8B for companies serving transport, utilities and infrastructure.
All 64 buyout and growth funds of 2026, by region
United States and Canada
47 of the 64 funds come from North American managers: 46 in the US and Brookfield in Toronto. The typical US fund is about $910M; lower middle market funds of $200–700M come from firms like Mangrove Equity Partners, 154 Partners and Rising Point Capital Management.
| Firm | HQ | 2026 fund | Fund size | Sectors |
|---|---|---|---|---|
| Advent InternationalAdvent is a leading global private equity investor committed to working in partnership with management teams, entrepreneurs, and founders to help transform businesses. | Boston | GPE XI | $27B | Business Services (B2B), Consumer Products |
| Goldman Sachs ESSGGoldman Sachs ESSG is a division of Goldman Sachs, a highly reputed financial institution headquartered in New York City. Established in 1869, Goldman Sachs has grown to become a global leader in investment banking, securities, and investment management. | New York | West Street Capital Partners IX | $9.60B | Business Services (B2B), Medical Devices |
| THL PartnersTHL Partners is a Boston-based private equity firm investing in middle-market growth companies in three industry groups: Financial Technology & Services, Healthcare, and Technology & Business Solutions. | Boston | THL Equity Fund X | $6.35B | Financial Services, Fintech |
| Gemspring CapitalGemspring Capital is a private equity firm based in Westport, Connecticut, founded in 2015 by Bret Wiener. The firm is composed of a team of 60 professionals, including managing directors with diverse backgrounds in investment and operations. | Westport | Gemspring Capital Fund IV | $3.50B | Aerospace, Business Services (B2B) |
| Kingswood Capital ManagementKingswood Capital Management LP is a private equity firm based in Los Angeles, California, managing $7.1 billion in assets. The firm focuses on middle-market companies, aiming to drive operational improvements through strategic partnerships. | Los Angeles | Kingswood Capital Opportunities Fund IV | $3.10B | Automotive, Business Services (B2B) |
| Advent InternationalAdvent is a leading global private equity investor committed to working in partnership with management teams, entrepreneurs, and founders to help transform businesses. | Boston | Mid-Market Fund | $3B | Business Services (B2B), Consumer Products |
| Warren EquityWarren Equity is a private equity firm based in Jacksonville Beach, Florida, founded in 2015 by Steven Wacaster, Scott Bruckmann, and Henrik Dahlback. | Jacksonville Beach | Warren Equity Partners Fund V | $2.80B | Transportation, Utilities |
 Lightyear CapitalLightyear Capital is a private equity firm based in New York City, established over 25 years ago with a team comprising over 50 professionals. | New York | Lightyear Fund VI, L.P. | $2.50B | Business Services (B2B), Financial Services |
 BrookfieldBrookfield is a global asset management firm headquartered in Toronto, Canada, with additional significant presence worldwide. The firm was originally established in 1899 and has developed into one of the largest investors in real assets in the world. | Toronto | Brookfield Middle East Partners (BMEP) | $2B | Financial Services, Industrial |
 Levine Leichtman Capital PartnersLevine Leichtman Capital Partners (LLCP) is a Los Angeles-based private equity firm with a 42-year history, focusing on middle market investments. | Los Angeles | LLCP Lower Middle Market IV | $2B | Business Services (B2B), Consumer Services (B2C) |
 SkyKnight CapitalSkyKnight Capital is a private equity firm based in Burlingame, California, founded in 2015. The firm is led by a team of 25 professionals, including 6 partners, and focuses on building long-term relationships with management teams and Limited Partners. | San Francisco | SkyKnight Capital Fund V, L.P. | $2B | Business Services (B2B), Financial Services |
 L Squared Capital PartnersL Squared Capital Partners is a private equity firm based in Newport Beach, California, founded in July 2014. The firm was formed with a team holding over 130 years of collective investing experience in growing companies. | Newport Beach | L Squared Capital Partners Fund V | $2B | Education, Marketing and Advertising |
 Capitol Meridian PartnersCapitol Meridian Partners is a private equity firm based in Washington, DC, founded in 2021 by Brooke Coburn and Adam Palmer, who have deep experience in national security and government sectors. | Washington | Capitol Meridian Fund II | $1.90B | Aerospace, Defense |
 FFL PartnersFFL Partners is a private equity firm based in San Francisco that specializes in healthcare and tech-enabled services for middle-market companies. | San Francisco | FFL Capital Partners VI LP | $1.35B | Business Services (B2B), Healthcare Services |
 Consonance Capital PartnersConsonance Capital Partners is a private equity firm based in New York, specializing in healthcare investments. | New York | Consonance Private Equity III | $1.35B | Healthcare Services |
 Serent CapitalSerent Capital is a private equity firm based in Austin, Texas, and San Francisco, California, founded in 2008. The firm specializes in investments in founder-led software and technology-enabled services companies. | San Francisco | Serent Capital VI, L.P. | $1.30B | Software, Technology |
 TPGTPG is a leading private equity firm based in the United States, founded in 1992. It has a strong presence globally, with a team of over 1,900 employees across 30 offices worldwide. | San Francisco | TPG Emerging Companies Asia | $1.30B | Business Services (B2B), Consumer Services (B2C) |
 Princeton Equity GroupPrinceton Equity Group is a private equity firm based in Princeton, New Jersey, founded in 2006. The firm specializes in partnering with franchisor and multi-location businesses, focusing on consumer, healthcare, and business services industries. | Princeton | Princeton Equity Partners III | $1.30B | Business Services (B2B), Technology |
 InvestcorpInvestcorp is a global investment manager, specializing in alternative investments across four asset classes: Private Equity (Mid-Market Buyouts, Growth Investments, and GP Staking), Real Assets (Real Estate and Infrastructure), Credit (CLOs, Broadly Syndicated Loans & Structured Credit, and Middle-Market Direct Lending), and Liquid Strategies (Absolute Return Investments and Insurance Asset Management). | New York | North American Private Equity Fund II | $1.22B | Business Services (B2B), Consumer Services (B2C) |
| Citation CapitalCitation Capital is a private equity firm based in Dallas, Texas, and was founded in 2023 by Tiffany K. | Dallas | Citation Fund I | $1.20B | Business Services (B2B), Consumer Products |
 TruArc PartnersTruArc Partners is a middle market private equity firm based in New York, established in 2021. The firm was founded by a senior investment team with extensive experience, having executed $3.4 billion in private equity investments since 2005. | New York | TruArc Partners Fund V | $1.20B | Business Services (B2B), Industrial |
 Sheridan Capital PartnersSheridan Capital Partners is a private equity firm based in Chicago, Illinois, founded by Jonathan Lewis and Sean Dempsey. | Chicago | Sheridan Capital Partners Fund IV | $1.10B | Healthcare Services, Medical Devices |
 Aphias CapitalAphias Capital is a private equity firm based in San Francisco, founded in 2025. The firm is led by a team of 16 professionals, including partners Amanda Kalin and Robert Wolfson, who bring extensive experience from H.I.G. | San Francisco | Aphias Capital Fund I | $1.05B | Business Services (B2B), Healthcare Services |
 AldaronAldaron is a private investment firm based in San Francisco and New York, founded by Will Oberndorf, Evan Mendez, and Jay Grewal. The firm focuses on transforming established businesses through the application of artificial intelligence. | San Francisco | Aldaron Fund I | $950M | Business Services (B2B) |
 GenNx360 Capital PartnersGenNx360 Capital Partners is a private equity firm based in New York, founded in 2006. The firm is led by a team of investment leaders and senior operating executives who focus on driving value through operational engagement and investment excellence. | New York | GenNx360 Capital Partners IV, L.P. | $865M | Aerospace, Business Services (B2B) |
 Align Capital PartnersAlign Capital Partners is a private equity firm based in Dallas, Texas, founded in 2016. The firm is led by a team of experienced professionals with a focus on partnering with business owners to accelerate growth. | Dallas | Align Capital Partners Fund IV LP | $770M | Business Services (B2B), Industrial |
 O2 Investment PartnersO2 Investment Partners is a private equity firm based in Bloomfield Hills, Michigan, founded in 2010. | Bloomfield Hills | O2 Investment Partners Fund V | $670M | Healthcare Services, Real Estate |
 Uplift InvestorsUplift Investors is a private equity firm based in Darien, Connecticut, founded in March 2025 by Will Hausberg, Doug Rosenstein, and Brad Skaf. | Darien | Fund I | $670M | Business Services (B2B), Financial Services |
 Dominus CapitalDominus Capital is an operationally-focused private equity firm based in New York, founded in 2008 by Gary Binning and his team. The firm consists of senior investment professionals and former CEOs with a cohesive working relationship spanning decades. | New York | Dominus Capital Partners IV LP | $640M | Aerospace, Automotive |
 Regal Healthcare Capital PartnersRegal Healthcare Capital Partners is a private equity firm based in New York specializing in the healthcare services sector. | New York | Fund IV | $610M | Healthcare Services |
| Argonaut Private EquityArgonaut Private Equity is a private equity firm based in Tulsa, Oklahoma, founded in 2004. Led by CEO Steve Mitchell, the firm is one of the largest in the Central U.S. | Tulsa | Argonaut Private Equity Fund VI | $606M | Business Services (B2B) |
 Monomoy Capital PartnersMonomoy Capital Partners is a private investment firm based in New York City, founded in 2005. The firm specializes in private equity and credit investing, focusing on the middle market. | New York | Monomoy Family Fund I | $589M | Business Services (B2B), Consumer Products |
 Continuim Equity PartnersContinuim Equity Partners is a private equity firm based in Pittsburgh, PA, founded in 2021. The firm focuses on acquiring and accelerating growth in manufacturing and industrial businesses. | Pittsburgh | Continuim Equity Partners Fund III, LP | $548M | Business Services (B2B), Industrial |
 Siguler GuffSiguler Guff is a multi-strategy private equity investment firm based in New York, United States, founded in 1995. The firm has a global presence with 13 offices and a team of 145 employees. | New York | Global Emerging Markets Growth Opportunities Fund II (GEMGO II) | $500M | Consumer Services (B2C), Financial Services |
 Iron Path CapitalIron Path Capital is a private equity firm based in Nashville, Tennessee, founded in 2021 by Scott Mraz and Rob Reistetter. Both founders have extensive backgrounds in finance and investment, having studied together at Ithaca College and worked at Quad-C. | Nashville | Iron Path Capital Fund II | $450M | Business Services (B2B), Chemicals |
 Broadwing Capital ManagementBroadwing Capital Management is a private equity firm based in Dallas, founded in 2022 by Eliot Kerlin and Andrew Boisseau. | Dallas | Broadwing Capital Fund I LP | $440M | Business Services (B2B), IT Services |
 154 Partners154 Partners is a private equity firm based in New York City, founded in 2025 by Isaac Harrouche and Mike Berlin, both of whom started their careers at Blackstone. | New York | 154 Partners Fund I, LP | $400M | Business Services (B2B), Consumer Products |
 Estancia Capital ManagementEstancia Capital Management is a specialist private equity firm based in Scottsdale and Philadelphia, focusing on the lower middle-market financial services industry. | Scottsdale | Estancia Capital Partners Fund III, L.P. | $367M | Financial Services |
 Rising Point Capital ManagementRising Point Capital Management is a private equity firm based in Chicago, Illinois. Founded in 2019 by Michael Drai and Justin Marku, the firm is managed by partners Natalie Greene and Marc Perez among others. | Chicago | Rising Point Capital Management Fund I | $325M | Business Services (B2B), Construction |
 5th Century Partners5th Century Partners is a private equity firm based in Chicago, Illinois, founded in 2021. The firm is composed of a diverse team of experienced investors and strategic operators, with a focus on driving growth in their portfolio companies. | Chicago | 5CP Fund II | $276M | Healthcare Services, Real Estate |
 LongWaterLongWater is a private markets investment firm headquartered in Fargo, ND, Dallas, TX, and St. Louis, MO. | Fargo | Inaugural SBIC Fund | $262.5M | Financial Services |
 Artemis Capital PartnersArtemis Capital Partners is a private equity firm based in Boston, Massachusetts, founded in 2010. | Boston | Artemis Capital Partners IV, L.P. | $254M | Aerospace, Industrial |
 Savano Capital PartnersSavano Capital Partners is a private equity firm based in Baltimore, founded in 2010. The firm is led by Managing Partner Tom Smith. | Baltimore | Savano Capital Partners IV, L.P. | $252M | Fintech, Software |
 Mangrove Equity PartnersMangrove Equity Partners is a private equity firm based in Tampa, Florida, founded in 2006. The firm is led by a team of 14 professionals with extensive experience in private equity and operational management. | Tampa | Mangrove Investors IV, L.P | $250M | Business Services (B2B), Consumer Products |
 Seven Hills CapitalSeven Hills Capital is a private equity firm based in Nashville, Tennessee, founded in 2016. The firm was established by experienced investors and operators with a focus on healthcare services. | Nashville | Seven Hills Capital Fund II, L.P. | $235M | Healthcare Services, Marketing and Advertising |
 LionLight CapitalLionLight Capital, LP is a growth-oriented private equity firm based in Chapel Hill, NC. | Chapel Hill | LionLight Capital Fund I | $215M | Business Services (B2B), Financial Services |
 Savory FundSavory Fund is a private equity firm based in Salt Lake City, Utah, specializing in the restaurant industry. Established to pair capital with emerging restaurant concepts, Savory Fund is led by co-founders Andrew K. | Salt Lake City | Savory Fund III | $201.5M | Consumer Services (B2C), Food and Beverage |
United Kingdom and Europe
11 funds come from European managers, about $40B including CVC's €26B target. Norway has two: Norvestor's €2B flagship and Longship's NOK 2.4B fund. Eurozone mid-market deals were priced at a median 8.8x EBITDA in Q2 2026.
| Firm | HQ | 2026 fund | Fund size | Sectors |
|---|---|---|---|---|
| CVCCVC is a leading global private markets manager, based in Luxembourg, focused on private equity, secondaries, credit, and infrastructure. With a global network of 29 local offices, CVC has over €209 billion in assets under management. | Luxembourg | Europe / Americas Fund X | €26B initial target ($28.6B) | Energy, Infrastructure |
| CVCCVC is a leading global private markets manager, based in Luxembourg, focused on private equity, secondaries, credit, and infrastructure. With a global network of 29 local offices, CVC has over €209 billion in assets under management. | Luxembourg | CVC Capital Partners Catalyst III | €3B ($3.3B) | Energy, Infrastructure |
 NorvestorNorvestor is a private equity firm based in the Nordics, with seven offices across northern Europe. Founded over 30 years ago, the firm focuses on lasting growth through digital acceleration and strategic acquisitions. | Oslo | Norvestor X SCSp | €2B ($2.2B) | Business Services (B2B), Digital |
 Main Capital PartnersMain Capital Partners is a private equity firm based in The Hague, Netherlands, founded in 2003. The firm specializes in buyouts and investments in enterprise software companies across the Benelux, DACH, Nordics, France, and the United States. | The Hague | Main Foundation III | $1.38B | Healthcare Services, Real Estate |
 NextaliaNextalia is a private equity firm based in Milan, Italy, founded in 2021. The firm is led by Francesco Canzonieri and comprises a team of 33 professionals with extensive experience in private markets, mergers and acquisitions, and strategic consultancy. | Milan | Nextalia Private Equity II | €1.1B+ first close ($1.21B) | Business Services (B2B) |
 ArdianArdian is a private equity firm based in Paris, France, founded in 1996. The firm was formerly known as AXA Private Equity and is led by Dominique Senequier. | Paris | Ardian Semiconductor | $1.10B | Technology, Semiconductors / Chips |
 Bregal MilestoneBregal Milestone is a European private equity firm specialising in software investments, headquartered in Europe. It was founded by Jan Bruennler, Philippe Lautenberg, and Cyrus Shey. | London | Bregal Milestone III | €915M hard cap ($1.01B) | Business Services (B2B), Software |
 Preservation Capital PartnersPreservation Capital Partners is a private equity firm based in London, United Kingdom, founded in 2017. The firm specializes in control investments within the financial and business services sectors across Western Europe. | London | PCP Fund III | €877M hard cap ($965M) | Business Services (B2B), Financial Services |
 LongshipLongship is a private equity investor targeting medium sized growth companies in Norway. The Longship fund is advised by Longship AS. | Oslo | Longship Fund IV | NOK 2.4B hard cap ($228M) | Healthcare Services, SaaS |
| Avallon MBOAvallon MBO is a private equity firm based in Poland, founded approximately 25 years ago. The firm is a pioneer in the management buyout market in Poland, focusing on partnerships with managers, founders, and business owners. | Łódź | Fourth Fund | €171.5M launched ($189M) | Business Services (B2B), Consumer Products |
 BlackPeak CapitalBlackPeak Capital is a private equity investor based in Sofia, established in 2014 by Rossen Ivanov and Ivailo Gospodinov. The firm focuses on growth equity investments, primarily in Southeast and Central Europe. | Sofia | Southeast Europe Growth Equity Fund II | €125M first close ($138M) | Digital, E-commerce/Marketplace |
Asia
6 funds come from managers in Hong Kong, Thailand, Vietnam and India. PAG's planned $4B buyout fund is the largest; the other five are $170–305M.
| Firm | HQ | 2026 fund | Fund size | Sectors |
|---|---|---|---|---|
| PAGPAG is a leading private equity firm based in Hong Kong, founded in 2002. The firm focuses on alternative investments across the Asia-Pacific region, with principal offices in Tokyo, Hong Kong, and Singapore. | Hong Kong | Asia Buyout Fund (raising) | about $4B, reportedly planned | Semiconductors / Chips, AI |
 Lakeshore CapitalLakeshore Capital is a private equity firm based in Bangkok, Thailand, established in 2009. The firm was co-founded by Panaikorn Chartikavanij, who serves as Managing Partner. | Bangkok | Lakeshore Capital Partners Fund III | $305M | Business Services (B2B), Consumer Products |
 3V Partners3V Partners is a private equity firm based in Vietnam. The firm is preparing to launch its debut private equity fund, targeting a raise of $300 million. | Hanoi | Debut PE Fund | $300M target | Financial Services |
 ZQ CapitalZQ Capital is a cross-border private equity firm based in Hong Kong, founded in 2016 by Simon Shen, a former Goldman Sachs and Barclays executive. | Hong Kong | Flagship Fund | $300M | Consumer Products, Education |
 Carpediem AdvisorsCarpediem Capital is an Indian private equity fund manager focused on the India consumption opportunity through investments in emerging SME (small and medium enterprise) leaders. | Mumbai | Carpediem Capital Fund III | $210M target | Business Services (B2B) |
 Excelsior Capital VietnamExcelsior Capital Vietnam is a private equity firm based in Vietnam, established to partner with outstanding entrepreneurs to realize growth and expansion aspirations. | Vietnam | Second Fund | $170M | Consumer Products, Digital |
Listed vs private vs small business multiples
| What is sold | Profit measure | Typical multiple, 2026 | Who buys |
|---|---|---|---|
| Listed US company | EBITDA | 16.95x average outside finance; 5–35x by industry | Stock market investors |
| Eurozone company worth €15–500M | EBITDA | 8.8x median; 10.2x from funds | Private equity and corporates |
| US middle market company | Adjusted EBITDA | 7.0x average | Private equity |
| Small owner-run business | Seller's discretionary earnings | Lower; see our business valuation calculator | Individuals, search funds, small private equity |
Size: in the eurozone, the upper mid-market (€150–500M) drove the Q2 2026 rise, while the €15–150M segment held flat.
Growth and margin: sectors with high margins carry higher revenue multiples; application software earns 33.21% and trades at 11.41x revenue.
Interest rates: 10-year eurozone bond yields rose from 3.34% to about 3.45% in Q2 2026, per the Argos Index. Higher rates make debt dearer, which caps what a buyer can pay.
Buyer type: in the eurozone, funds paid 2.3 turns more than corporates in Q2 2026.
Fund deal mix: funds made 14% of eurozone mid-market deals in the first half of 2026 but 32% of disclosed deal value.
How to use EBITDA multiples by industry
Start from the right benchmark: private deals sit closer to 7–9x than to the listed figure for your industry. Use the listed table to see whether your sector is rated above or below the 13.36x middle.
Adjust for size: a company with $2M of EBITDA will usually sell below the multiple a $50M company gets.
Check with a DCF: the business valuation calculator runs a 5-year DCF; take the discount rate from the WACC calculator.
Find the buyers: filter private equity firms by sector, such as healthcare services, business services and industrial. Our guide to private equity buyers covers the sale process, and M&A advisors run it for you.
Raising instead of selling: for growth capital, the capital raise guide lists who is writing cheques; the equity dilution calculator shows what a valuation means for your stake. New funds are on the new VC funds tracker, and contacts and exports are on the pricing page.
Data and methodology
Funds: 64 buyout and growth funds from 62 firms with a published Private Equity List profile, announced 1 January–18 November 2026 and checked against the announcement in our fund tracker. Venture, credit, real estate, infrastructure, secondaries, co-investment and fund-of-funds vehicles were left out.
Sizes and sectors: fund size as announced (targets and first closes are marked), converted to US dollars at the tracker's rate; sectors are the fund's tags in Private Equity List, and a fund can name several.
External figures: EBITDA multiples by industry are Damodaran (US listed companies, January 2026); US private multiples are GF Data via Mercer Capital; eurozone figures are the Argos Index for Q2 2026. All are linked in the text.
Examples: worked examples are illustrative, not data.

 Updated weekly
 Investors